Data Visualization
POST IMAGESART DIRECTION, ILLUSTRATION & DESIGNChallenge: Simplify complex financial information for a wide audience and make it visually engaging, ensuring readers could easily understand and digest content that is typically dry or intimidating.
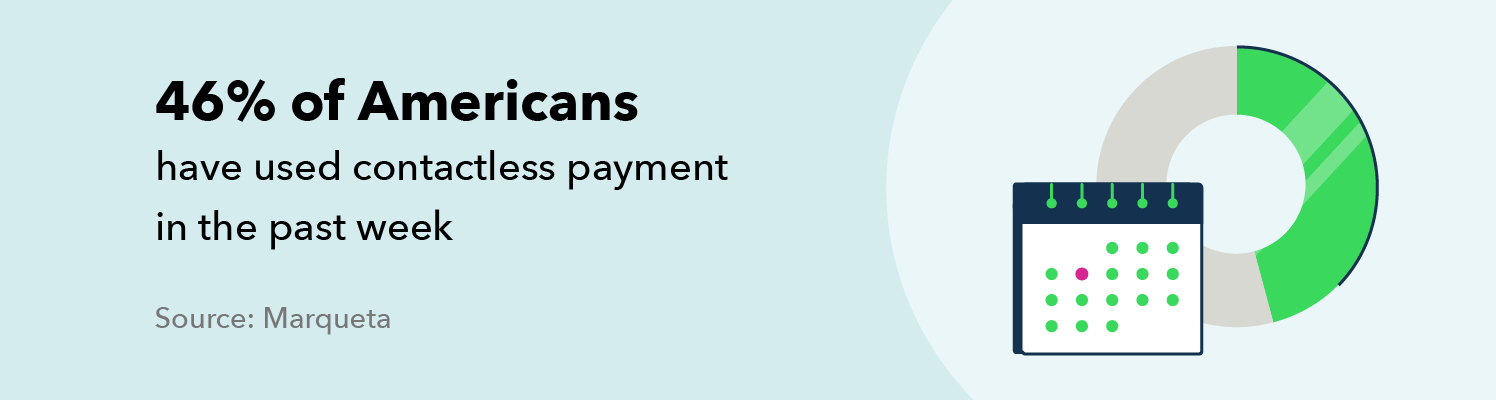
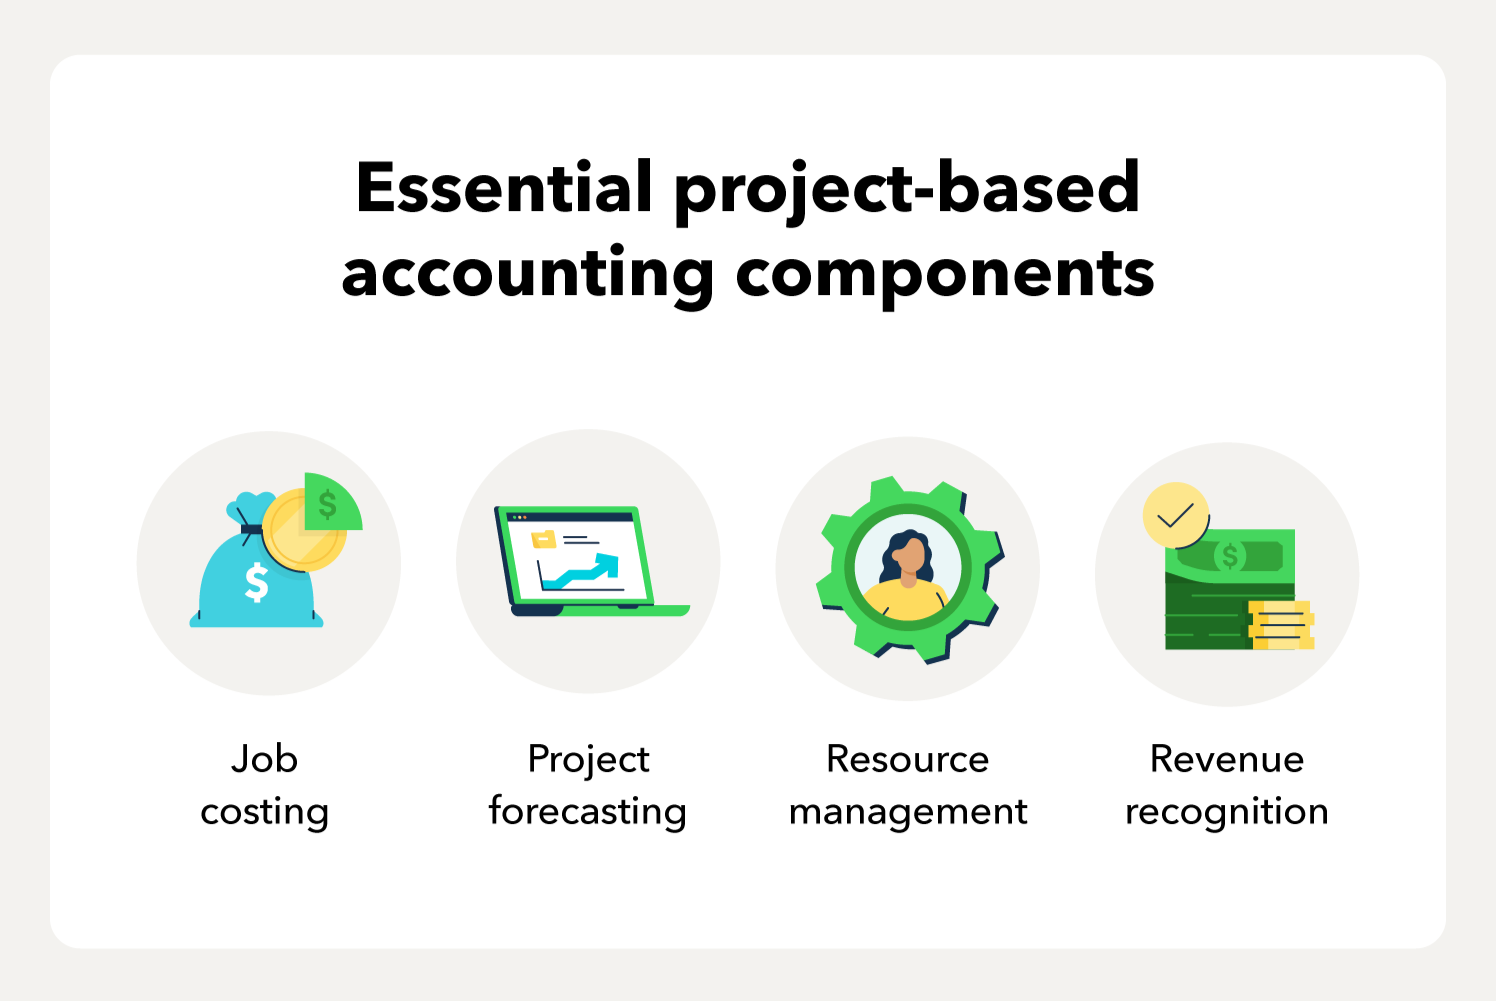
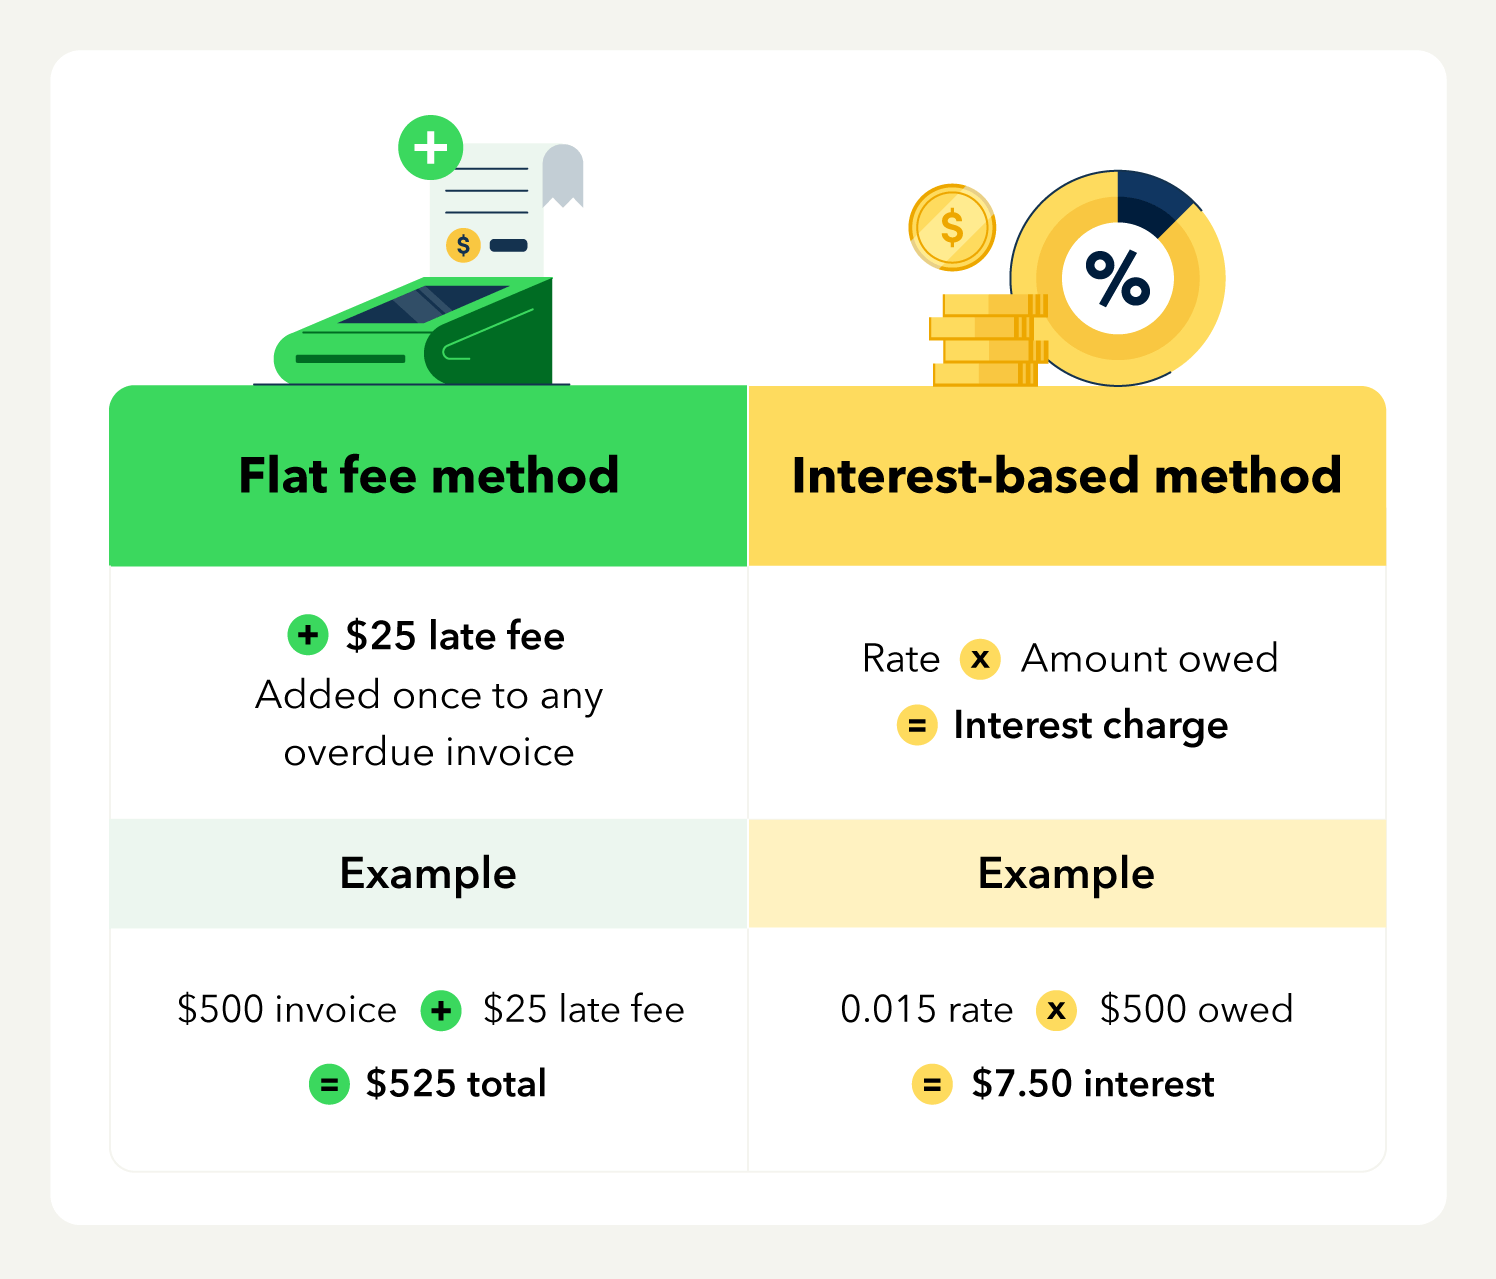
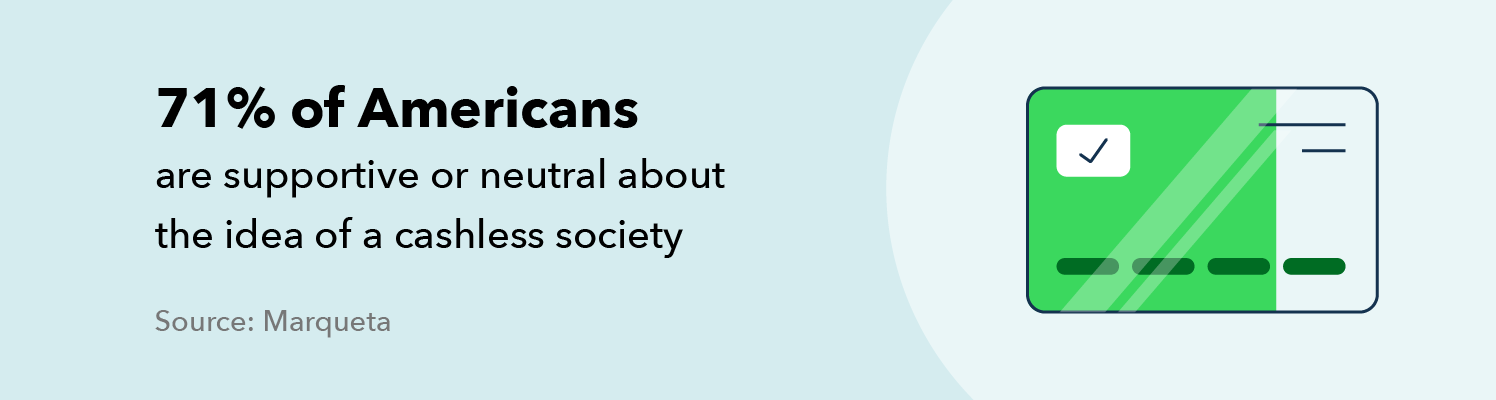
Approach: I led the visual design from concept to execution, creating layouts, illustrations, and data-driven visuals. Hierarchy and clear visual cues helped guide users through the information, while pie charts, iconography, and colorful illustrations brought the data to life—highlighting dramatic trends and supporting comprehension even for users unfamiliar with finance. I collaborated closely with content marketing specialists to identify which information should be emphasized and how to visually tell the story.
Outcome: The visuals helped make the posts more accessible and engaging. The client provided very positive feedback, noting improved user engagement and increased site visits.